Thursday, 6 November 2025









Sunday, 2 November 2025
Economic Calendar Overview👀 (Mon 03 Nov - Fri 07 Nov)

Economic Calendar Overview👀 (Mon 03 Nov - Fri 07 Nov)
Sunday, 26 October 2025
Economic Calendar Overview👀 (Mon 27 Oct - Fri 31 Oct)

Economic Calendar Overview👀 (Mon 27 Oct - Fri 31 Oct)
Friday, 24 October 2025
Easy method to determine next target based on candle close
By David Perk aka Dave Fx Hunter, 9 hrs ago
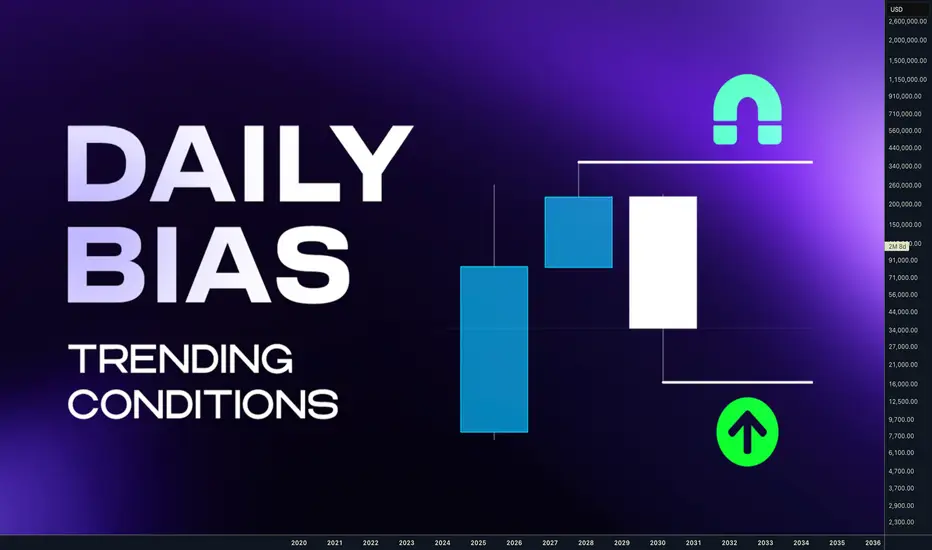
Hey traders today we are going to look in how to determine Daily Bias. Its actually not that complicated how many people thinks.
Please forget about higher highs, and higher lows, channels and moving averages. Yes these can be also used, but we will be looking at the market in terms where is the liquidity and we will be determining the bias based on candle closes which tell us where the liquidity is resting.
We will look at the Daily bias, but as I mentioned this many times in my posts - price is fractal so you can use this at any timeframe. But, If I can give you recommendations look for Higher timeframe bias on Daily and Weekly and H4 / H1 Structure and M15 entries.
This post will be about continuation setups in a trend, I will touch a bit reversal because it's part of setup on LTF in the continuation. Something will be shown on bearish examples something bullish I hope you can use imagination for both sides.
⁉️Where is the liquidity ? Always follow the Daily / Weekly candle close.
📈 Continuation
If todays daily candle closed above previous days high and its still not reaching the key level, then liquidity is above todays high. Why ? Because people have intentions to sell highs to early, so and price will most likely go there. So we are bullish. Bullish Close 📈 Reversal
If todays candle wicked above previous day high, but closed below , then we can expect liquidity is below Previous days low. Why? Because mostl likely traders entered fake high break out they put SL below days low. It's signs of reversal. Every significant reversal wicked above PDH and closed inside, if not seen on PDH than its on weekly.
 ‼️ Yes, Its that simple - this is how I predict my bias for the setups.
There is obviously little bit more regarding the market context, because I want to be always selling highs and buying lows. Hence there must but pullback deep enough. I have explained how to buy low and sell highs in this post below. 🔗Click the picture to learn more 👇This is not about catching every significant highs and lows, you don't need it to be profitable. We are looking for the high probability trend continuation setups. We can catch highs and lows in the trend. After the stop hunt.
🧪In downtrend you want sell after stop hunt of short term highs 🧪In the uptrend you want be buying after stop hunts of short term lows
 I have explained more about stop hunts in this post. 🔗Click the picture to learn more 👇Now, If we know the bias based on the Daily / Weekly candle close our goal is to position ourself in the right time for the continuation setup which will be during the lower timeframe reversal.
📌Reversal Setup
first lets have a look to the reversal. We want see a candle high being taken and closed below. In that case draw on liquidity is below the daily low. Sign of reversal. So we can position ourselves in a trade as described on the picture, wick above and close inside is not enough for the signifcant HTF reversal. But its enough for our continuation setup,
📌Continuation setup
We want to see bullish candle close above previous days high and not liquidity taken above that wick. Then we can assume that liquidity is still resting above and we want to position ourselves during the LTF reversal in the direction of the HTF liquidity. same case will be for this bearish example where we can see how candles closed below the previous days low and last low was not swept hence we can expect price to visit that low again, we have spotted potential reversal by wicking above the candles high and close below and than we can position ourselves to the short and target daily lows.
 📌 Continuation LTF reversal timing
same case now you must already see it bullish close above PDH and that high was not swept so liquidity is still above , next day is inside candle once price dips below inside candle low we cans spot reversal setup on LTF and by creation of order block we enter the position during the NY session manipulation 📌 No Stop hunt = No trade
if liquidity was not taken don't enter. Yes you can miss a trade it doesnt happen always, but if it doesnt happen it's not your setup so you didnt miss anything. On this example you can see that we had almost same setup. Bullish daily candle close. High was not swept, and than 2 inside candles. 3 candle manipulated lows and another candle was expansion. Now still focus the the picture above 2nd candle that candle is a range you are entering it after that range was manipulated. Look how price reached 50% of that range , retraced and than it went full range. Its Trading model 1 and Model 2. You mostly get 2 chances to trade it.
 Trading ranges is in my opinion least subjective approach and unlike diagonal drawings or multiple various pattern it has defined rules. I have described this strategy in details in this post below. 🔗 Click the picture to learn more 👇📌 Final example for today - Schematics
Now try it alone - step by step
1) How are candles closing
2) Was the Liquidity on the low taken ? No - price might go there - Im bearish
3) Lets wait for the LTF reversal - bearish this scheme was actually traded and posted here on Tradingview as a Continuation setup Model 1 & 2 🔗 Click picture below to learn how price action developed👇💊 Here are few more examples based on this trading logic
1️⃣GBPUSD Daily range - Continuation setup Model 1 & 2
🔗 Click picture below to learn how price action developed 👇2️⃣AUDUSD Daily range - Continuation setup Model 1 & 2
🔗 Click picture below to learn how price action developed 👇3️⃣DOGE Daily range - Continuation setup Model 1 & 2
🔗 Click picture below to learn how price action developed 👇Final words
Is this holy grail ? Almost.
Why is this approach great ? It's mechanical system for analysis - No subjective guessing.
Does it prevent me from losses ? No, I can make and I sometimes I do mistakes in analysis, Im not perfect.
Dont trust me , Im just a guy from the internet. Verify it by yourself and see if you take some of it to your trading arsenal.
Adapt useful, Reject useless and something specifically your own.
David Perk aka Dave Fx Hunter
Hey traders today we are going to look in how to determine Daily Bias. Its actually not that complicated how many people thinks.
Please forget about higher highs, and higher lows, channels and moving averages. Yes these can be also used, but we will be looking at the market in terms where is the liquidity and we will be determining the bias based on candle closes which tell us where the liquidity is resting.
We will look at the Daily bias, but as I mentioned this many times in my posts - price is fractal so you can use this at any timeframe. But, If I can give you recommendations look for Higher timeframe bias on Daily and Weekly and H4 / H1 Structure and M15 entries.
This post will be about continuation setups in a trend, I will touch a bit reversal because it's part of setup on LTF in the continuation. Something will be shown on bearish examples something bullish I hope you can use imagination for both sides.
⁉️Where is the liquidity ? Always follow the Daily / Weekly candle close.
📈 Continuation
If todays daily candle closed above previous days high and its still not reaching the key level, then liquidity is above todays high. Why ? Because people have intentions to sell highs to early, so and price will most likely go there. So we are bullish. Bullish Close
If todays candle wicked above previous day high, but closed below , then we can expect liquidity is below Previous days low. Why? Because mostl likely traders entered fake high break out they put SL below days low. It's signs of reversal.
There is obviously little bit more regarding the market context, because I want to be always selling highs and buying lows. Hence there must but pullback deep enough. I have explained how to buy low and sell highs in this post below. 🔗Click the picture to learn more 👇This is not about catching every significant highs and lows, you don't need it to be profitable. We are looking for the high probability trend continuation setups. We can catch highs and lows in the trend. After the stop hunt.
🧪In downtrend you want sell after stop hunt of short term highs
📌Reversal Setup
first lets have a look to the reversal. We want see a candle high being taken and closed below. In that case draw on liquidity is below the daily low. Sign of reversal. So we can position ourselves in a trade
📌Continuation setup
We want to see bullish candle close above previous days high and not liquidity taken above that wick. Then we can assume that liquidity is still resting above and we want to position ourselves during the LTF reversal in the direction of the HTF liquidity.
same case now you must already see it bullish close above PDH and that high was not swept so liquidity is still above , next day is inside candle once price dips below inside candle low we cans spot reversal setup on LTF and by creation of order block we enter the position during the NY session manipulation
if liquidity was not taken don't enter. Yes you can miss a trade it doesnt happen always, but if it doesnt happen it's not your setup so you didnt miss anything. On this example you can see that we had almost same setup. Bullish daily candle close. High was not swept, and than 2 inside candles. 3 candle manipulated lows and another candle was expansion.
Now try it alone - step by step
1) How are candles closing
2) Was the Liquidity on the low taken ? No - price might go there - Im bearish
3) Lets wait for the LTF reversal - bearish
1️⃣GBPUSD Daily range - Continuation setup Model 1 & 2
🔗 Click picture below to learn how price action developed 👇2️⃣AUDUSD Daily range - Continuation setup Model 1 & 2
🔗 Click picture below to learn how price action developed 👇3️⃣DOGE Daily range - Continuation setup Model 1 & 2
🔗 Click picture below to learn how price action developed 👇Final words
Is this holy grail ? Almost.
Why is this approach great ? It's mechanical system for analysis - No subjective guessing.
Does it prevent me from losses ? No, I can make and I sometimes I do mistakes in analysis, Im not perfect.
Dont trust me , Im just a guy from the internet. Verify it by yourself and see if you take some of it to your trading arsenal.
Adapt useful, Reject useless and something specifically your own.
David Perk aka Dave Fx Hunter

Economic Calendar Overview👀 (Mon 20 Oct - Fri 24 Oct)

Economic Calendar Overview👀 (Mon 20 Oct - Fri 24 Oct)
Sunday, 19 October 2025
How to trade a Fakeout step-by-step

This chart shows a common trading strategy in financial markets (such as Forex or equities): identifying a fakeout and profiting from it. A fakeout is when it appears price has broken a support or resistance level, then suddenly reverses and moves the other way, catching traders who entered on the breakout.
---
1. Clean bullish move
At the start of the chart we see a series of green candles indicating a strong, steady upward move.
This move builds market confidence and serves as an initial sign of bullish strength.
2. Support & resistance
Support: a price level expected to stop declines and cause a rebound. In the chart it’s the lower horizontal line.
Resistance: a price level expected to halt advances and cause a decline. In the chart it’s the upper horizontal line.
These zones represent important psychological and technical levels for traders.
3. The breakout
After the bullish move we see a large green candle breaking above the resistance line. This is called a breakout.
Under normal conditions, a breakout above resistance is a strong buy signal, as continued upside is expected.
4. The fakeout
Here’s the crucial part: after the breakout, instead of continuing higher, price suddenly begins to fall.
That is the fakeout — traders who bought the breakout are deceived because price returns downward.
The chart shows this with a red downward arrow labeled “FAKE OUT”.
5. Liquidity area
The pink shaded area above the resistance line is the liquidity zone.
In market analysis, a liquidity zone is where traders leave orders (such as stop losses or take-profits). When price moves into this zone it can “collect” those orders and then reverse.
In many fakeouts, price targets this area to gather liquidity before reversing down.
6. Price returns to the area
After the fakeout, price returns to the support or the previously broken resistance.
This return confirms that the breakout was false rather than real.
7. Entry areas
Risky entry area: near the peak of the fakeout. Entry here is risky because price may remain unstable and continue to move against you.
Safe entry area: on the return to the former support (or previous resistance). Entering here is safer because you’re waiting for confirmation of the reversal.
8. Clean bearish move
After entering safely near the support, we see a series of red candles indicating a strong, steady downward move.
The goal of the fakeout strategy is to enter the confirmed reversal and capture this clean bearish move.
---
Strategy summary
1. Watch the bullish move and the resistance level.
2. Wait for a breakout above resistance.
3. Observe whether price continues up or returns down (fakeout).
4. If a fakeout occurs, wait for price to return to the support area.
5. Enter a short at the safe entry area.
6. Target the clean bearish move for profit.
This strategy requires patience and careful monitoring to avoid falling into market traps.
PULLBACK AFTER BREAKOUT ENTRY

"PULLBACK AFTER BREAKOUT ENTRY"
(Entry After a Pullback Following a Breakout)
---
🎯 General Concept
This chart illustrates a common trading strategy used in Forex, stocks, and crypto. It is based on the following steps:
1. Breakout above a Resistance level.
2. Wait for a temporary Pullback after the breakout.
3. Enter the trade when price returns to the Demand Zone, which was previously a Resistance area.
4. Place a Stop Loss below the safe area.
5. Set an Initial Target for taking profit.
---
🔍 Detailed Breakdown of the Chart Elements
1. RESISTANCE
A horizontal grey line representing a previous resistance level where the price reacted multiple times.
When price breaks this level, it turns into future support (Support becomes Resistance, and vice versa).
---
2. BREAKOUT
Occurs when the price moves above the resistance level and begins to rise.
In the chart: a strong green candle breaks above the grey line → this is the Breakout moment.
---
3. PULLBACK
After breaking out, the price does not always continue moving up directly — it often pulls back slightly.
This is a retest of the previous resistance.
> ✅ Why wait for a pullback?
It reduces the risk of entering at the top and improves the Risk/Reward Ratio.
---
4. DEMAND ZONE
The zone where buying pressure (demand) is strong, acting as support.
In the chart: a grey rectangle below the resistance line — this is where price is expected to react.
Entry is planned when price bounces back from this zone.
---
5. ENTRY
Enter the trade after confirming a bullish reaction from the Demand Zone — such as a bullish candle or reversal pattern.
In the chart: the entry is marked with a blue circle after the red pullback candle rejects the zone.
---
6. STOP LOSS AREA
Placed below the Demand Zone.
If the price goes below this area, it indicates the breakout–pullback setup has failed.
In the chart: a red line marks this Stop Loss level.
---
7. INITIAL TARGET
A predefined price level to take profit.
In the chart: shown with a dashed green line above the price.
It can be set using Risk/Reward ratio like 1:2 or 1:3, or based on previous highs or Fibonacci levels.
---
📈 Practical Example (Upper Chart)
The price was ranging between support and resistance → then broke above resistance (Breakout).
Price pulled back to retest the level — forming a Demand Zone.
Entry was taken after rejection.
Stop Loss placed below the zone.
Target placed above for profit.
---
📉 Lower Illustrative Chart
Shows the same idea in a simplified linear drawing.
Highlights Breakout → Retest → Continuation.
Confirms that entry on retest is safer and more effective.
---
💡 Important Tips When Applying This Strategy
✅ Wait for confirmation — don’t enter just because price touched the zone.
✅ Use proper lot sizing — never risk all capital in
Thursday, 16 October 2025
Avoid Market Traps and filter best trading setups
Hey whats up guys,
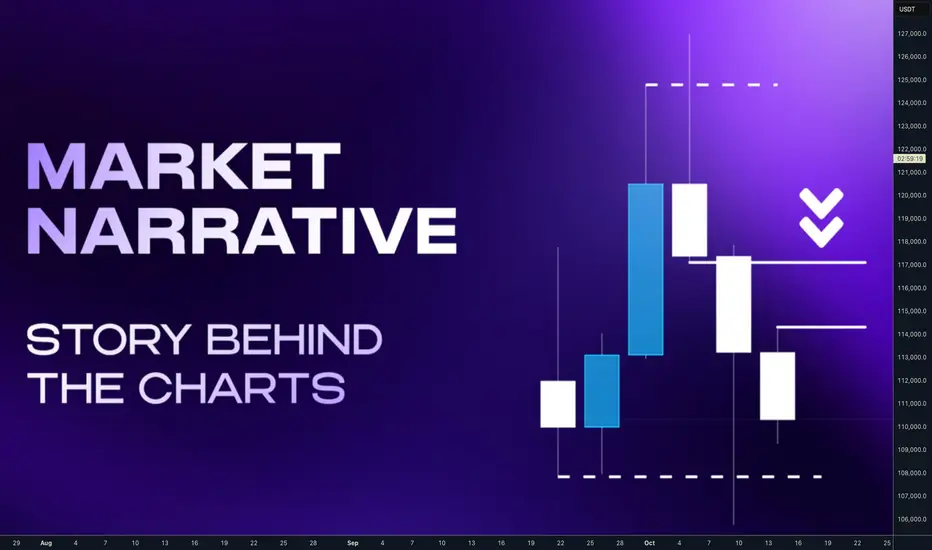
Let's have a look to the market narrative and building the potential scenarios of next outcome. It's not about predicting the market, but I would say rather about filtering out next potential outcomes of price action based on fixed criteria and price action laws.
📌Basic Market Phases
 But if that is so simple what is not everyone making money?
📌Its not that straight forward and every transition from range to expansion comes with manipulation's and false break outs.
 to understand market dynamics we need to understand how the smart money operator works.
📌Smart Money CLS company
This one institution trade over 6.5 Trillions daily volume on forex. Which is almost all the volume, they are Smart money trader and they trading for most of the central banks and investment banks. So these smaller players instead of trading against each other they make settlements via CLS and CLS finds the liquidity on the markets. How I know ? It's on their website. Just google it Now you know where comes my name for CLS Ranges. It's basically big range, high volume candles made by market maker which is CLS. Hence CLS range or range, name doesn't matter really.
🧪Smart money trader cant just simply press Buy or Sell Button like we do. If they do it, they will move the price without getting a fill at requested price for the all their orders the y need. In other words they will not have liquidity for their large operations. Hence they must follow specific framework to create liquidity and then load it.
🧩For understanding more about a Liquidity visit the post below.
🔗Click to the picture to open learn more 👇📌Accumulation - Manipulation - Distribution
it is what help them to get liquidity. Its also called stop hunt, but they really dont care about your or mine stop loss. We are to small and mostly our brokers are B-book anyway.
Let's say they need to fill 1000 contracts (example number) futures contracts on the 6E1 Euro contract. But they can get just 600 at the current market, hence they need to accumulate in the range as much as they can. The rest they will buy bellow / above the range.
🧪Bullish scenario AMD
Accumulating contracts in the range happening above the key level. False break up, will suck other market participants to the market and they will have liquidations bellow the range, thats is new liquidity created below the range. By hedging the positions, they manipulate price below the range to get the rest of contracts need by forcing early buyers to sell for the worse price. Then they close the hedge shorts in a profit and they start to move price up. If price is in the range you can spot it accumulation by seeing high volume on the lows.
❎ Action of less informed traders - bought early - stopped out, Sold the break of the low - wrong side of the trade. These traders were used as a liquidity. 🧪Bearish scenario AMD
Accumulating contracts in the range happening below the key level. False break down, will suck other market participants to the market and they will have liquidations above the range, thats is new liquidity created below the range. By hedging the positions, they manipulate price above the range to get the rest of contracts need by forcing early buyers to buy for the worse price. Then they close the hedge longs in a profit and they start to move price down If price is in the range you can spot it accumulation by seeing high volume on the highs.
❎Action of less informed traders - sold early - stopped out, Both the break of the top - wrong side of the trade. These traders were used as liquidity. 📌How to avoid being caught in these traps?we need to focus on the basics which is buying lows and selling highs and not to fomo to the running market moves. Im not saying you cant be profitable with break out strategies. But with buying lows in uptrend and selling highs in downtrend is better idea.
🧩How to do Buy low / Sell highs is explained this post below. 🔗Click to the picture to open lean more 👇from the post above you understand market structure.
each phase of the structure has specific market dynamics. We don't want to trade every up and down move. Just expansions are giving best risk rewards. and vice versa for bearish scenario. 📌How to know if there will be manipulation or not?
everything comes from the key level. Any pattern whatever we trade if there is no key level than its all invalid. Lets put the ranges and key levels together.
🧪Bullish Scenario
if you see range just above the key level. Smart money are building liqudity and there will be manipulation. If price is already on key level deep manipulation is not necessary. 🧪 Bearish Scenario
if you see range just below the key level. Smart money are building liqudity and there will be manipulation. If price is already on key level deep manipulation is not necessary.
📌Expansion + Key Level
if range occurs not just right above the key level but is a bit more far, we can expect expansion to reversal profile. Expansion to the key level is tradable and reversal also if there was range. This. knowledge give us possible expansion trade towards key level.
🧪Bearish scenario 🧪Bullish scenario
 there are also tricks with false reversal just below / above key level, market maker often leave double top and bottom , just round a key level and make it looks like ar reversal. Dont fall for this trap. Its done on purpose to put you early in to trade and you will put SL exactly where you they need liquify - followed by expansion to the key level and reveal. Targeting double top / bottom is high probability trade.
🧪Bearish Scenario 🧪Bullish Scenario
 📌Summary of Key Level and Profiles
Avoid trading range , manipulation and retracements
Trade only expansion and Reversal profiles
 This might sound complicated, but if you spend time with this. You will be filtering just best trade setups , trading less and more accurately.
David Perk aka DaveFXHunter
Let's have a look to the market narrative and building the potential scenarios of next outcome. It's not about predicting the market, but I would say rather about filtering out next potential outcomes of price action based on fixed criteria and price action laws.
📌Basic Market Phases
📌Its not that straight forward and every transition from range to expansion comes with manipulation's and false break outs.
📌Smart Money CLS company
This one institution trade over 6.5 Trillions daily volume on forex. Which is almost all the volume, they are Smart money trader and they trading for most of the central banks and investment banks.
🧪Smart money trader cant just simply press Buy or Sell Button like we do. If they do it, they will move the price without getting a fill at requested price for the all their orders the y need. In other words they will not have liquidity for their large operations. Hence they must follow specific framework to create liquidity and then load it.
🧩For understanding more about a Liquidity visit the post below.
🔗Click to the picture to open learn more 👇📌Accumulation - Manipulation - Distribution
it is what help them to get liquidity. Its also called stop hunt, but they really dont care about your or mine stop loss. We are to small and mostly our brokers are B-book anyway.
Let's say they need to fill 1000 contracts (example number) futures contracts on the 6E1 Euro contract. But they can get just 600 at the current market, hence they need to accumulate in the range as much as they can. The rest they will buy bellow / above the range.
🧪Bullish scenario AMD
Accumulating contracts in the range happening above the key level. False break up, will suck other market participants to the market and they will have liquidations bellow the range, thats is new liquidity created below the range. By hedging the positions, they manipulate price below the range to get the rest of contracts need by forcing early buyers to sell for the worse price. Then they close the hedge shorts in a profit and they start to move price up.
❎ Action of less informed traders - bought early - stopped out, Sold the break of the low - wrong side of the trade. These traders were used as a liquidity.
Accumulating contracts in the range happening below the key level. False break down, will suck other market participants to the market and they will have liquidations above the range, thats is new liquidity created below the range. By hedging the positions, they manipulate price above the range to get the rest of contracts need by forcing early buyers to buy for the worse price. Then they close the hedge longs in a profit and they start to move price down
❎Action of less informed traders - sold early - stopped out, Both the break of the top - wrong side of the trade. These traders were used as liquidity.
🧩How to do Buy low / Sell highs is explained this post below. 🔗Click to the picture to open lean more 👇from the post above you understand market structure.
each phase of the structure has specific market dynamics. We don't want to trade every up and down move. Just expansions are giving best risk rewards. and vice versa for bearish scenario.
everything comes from the key level. Any pattern whatever we trade if there is no key level than its all invalid. Lets put the ranges and key levels together.
🧪Bullish Scenario
if you see range just above the key level. Smart money are building liqudity and there will be manipulation. If price is already on key level deep manipulation is not necessary.
if you see range just below the key level. Smart money are building liqudity and there will be manipulation. If price is already on key level deep manipulation is not necessary.
📌Expansion + Key Level
if range occurs not just right above the key level but is a bit more far, we can expect expansion to reversal profile. Expansion to the key level is tradable and reversal also if there was range. This. knowledge give us possible expansion trade towards key level.
🧪Bearish scenario
🧪Bearish Scenario
Avoid trading range , manipulation and retracements
Trade only expansion and Reversal profiles
David Perk aka DaveFXHunter
Subscribe to:
Posts (Atom)
WHAT IS BREAKOUT → RE-TEST?
Breakout: When the price breaks a support or resistance level that it has tested before and moves above or below that level. Re-...

-
A love story. By James B. Stewart , THE NEW YORKER, A Reporter at Large February 3, 2002 Save this story Listen to this story Susan Greer...
-
Her fiction has imagined societies riddled with misogyny, oppression, and environmental havoc. These visions now feel all too real. By Rebe...

